How Much Should Your HVAC, Plumbing, or Electrical Company Spend on Marketing?
Last month, an HVAC contractor called us in a panic. He’d just spent $47,000 on a marketing campaign that generated exactly three leads. When we asked what percentage of his revenue that represented, he went silent. He had no idea.
This isn’t uncommon. Most home service business owners approach marketing budgets with either blind faith or paralyzing hesitation. They’ll invest six figures in a new truck without blinking, but freeze when allocating marketing dollars, often because they have no benchmark to guide their decisions.
After analyzing dozens of successful HVAC, plumbing, and electrical companies, we’ve found that the top performers follow a surprisingly consistent pattern: they invest 7–10% of their gross revenue into marketing. But the percentage is only the beginning. What matters more is how they spend it.
Why the 7–10% Rule Works
The 7–10% benchmark isn’t pulled from thin air, it’s the equilibrium point where home service companies can sustain growth without sacrificing profitability. Here’s how spending levels typically play out:
Below 5%: You’re relying almost entirely on referrals. This works until it doesn’t. Companies in this range often experience feast-or-famine cycles and rarely scale beyond $2–3M.
5–7%: Maintenance mode. You maintain visibility but won’t aggressively grow market share—fine for stable markets, but not for competitive ones.
7–10%: The growth zone. Companies investing at this level build dependable lead flow and usually see 15–30% year-over-year growth when the budget is allocated strategically.
Above 12%: Common for new market launches, aggressive expansion, or companies rebuilding reputation. Effective but not always sustainable long-term.
Real Marketing Budget Examples for $1M, $3M, and $5M Contractors
Here’s what the 7–10% rule looks like at different revenue levels:
$1M Annual Revenue: $70,000–$100,000 annually ($5,800–$8,300/month)
$3M Annual Revenue: $210,000–$300,000 annually ($17,500–$25,000/month)
$5M Annual Revenue: $350,000–$500,000 annually ($29,000–$42,000/month)
To make this more concrete: if you’re a $3M contractor spending $20,000/month and generating 50 qualified leads with a 40% close rate, that’s 20 new jobs. With an $8,500 average ticket, that’s $170,000 in revenue—an 8.5X return.
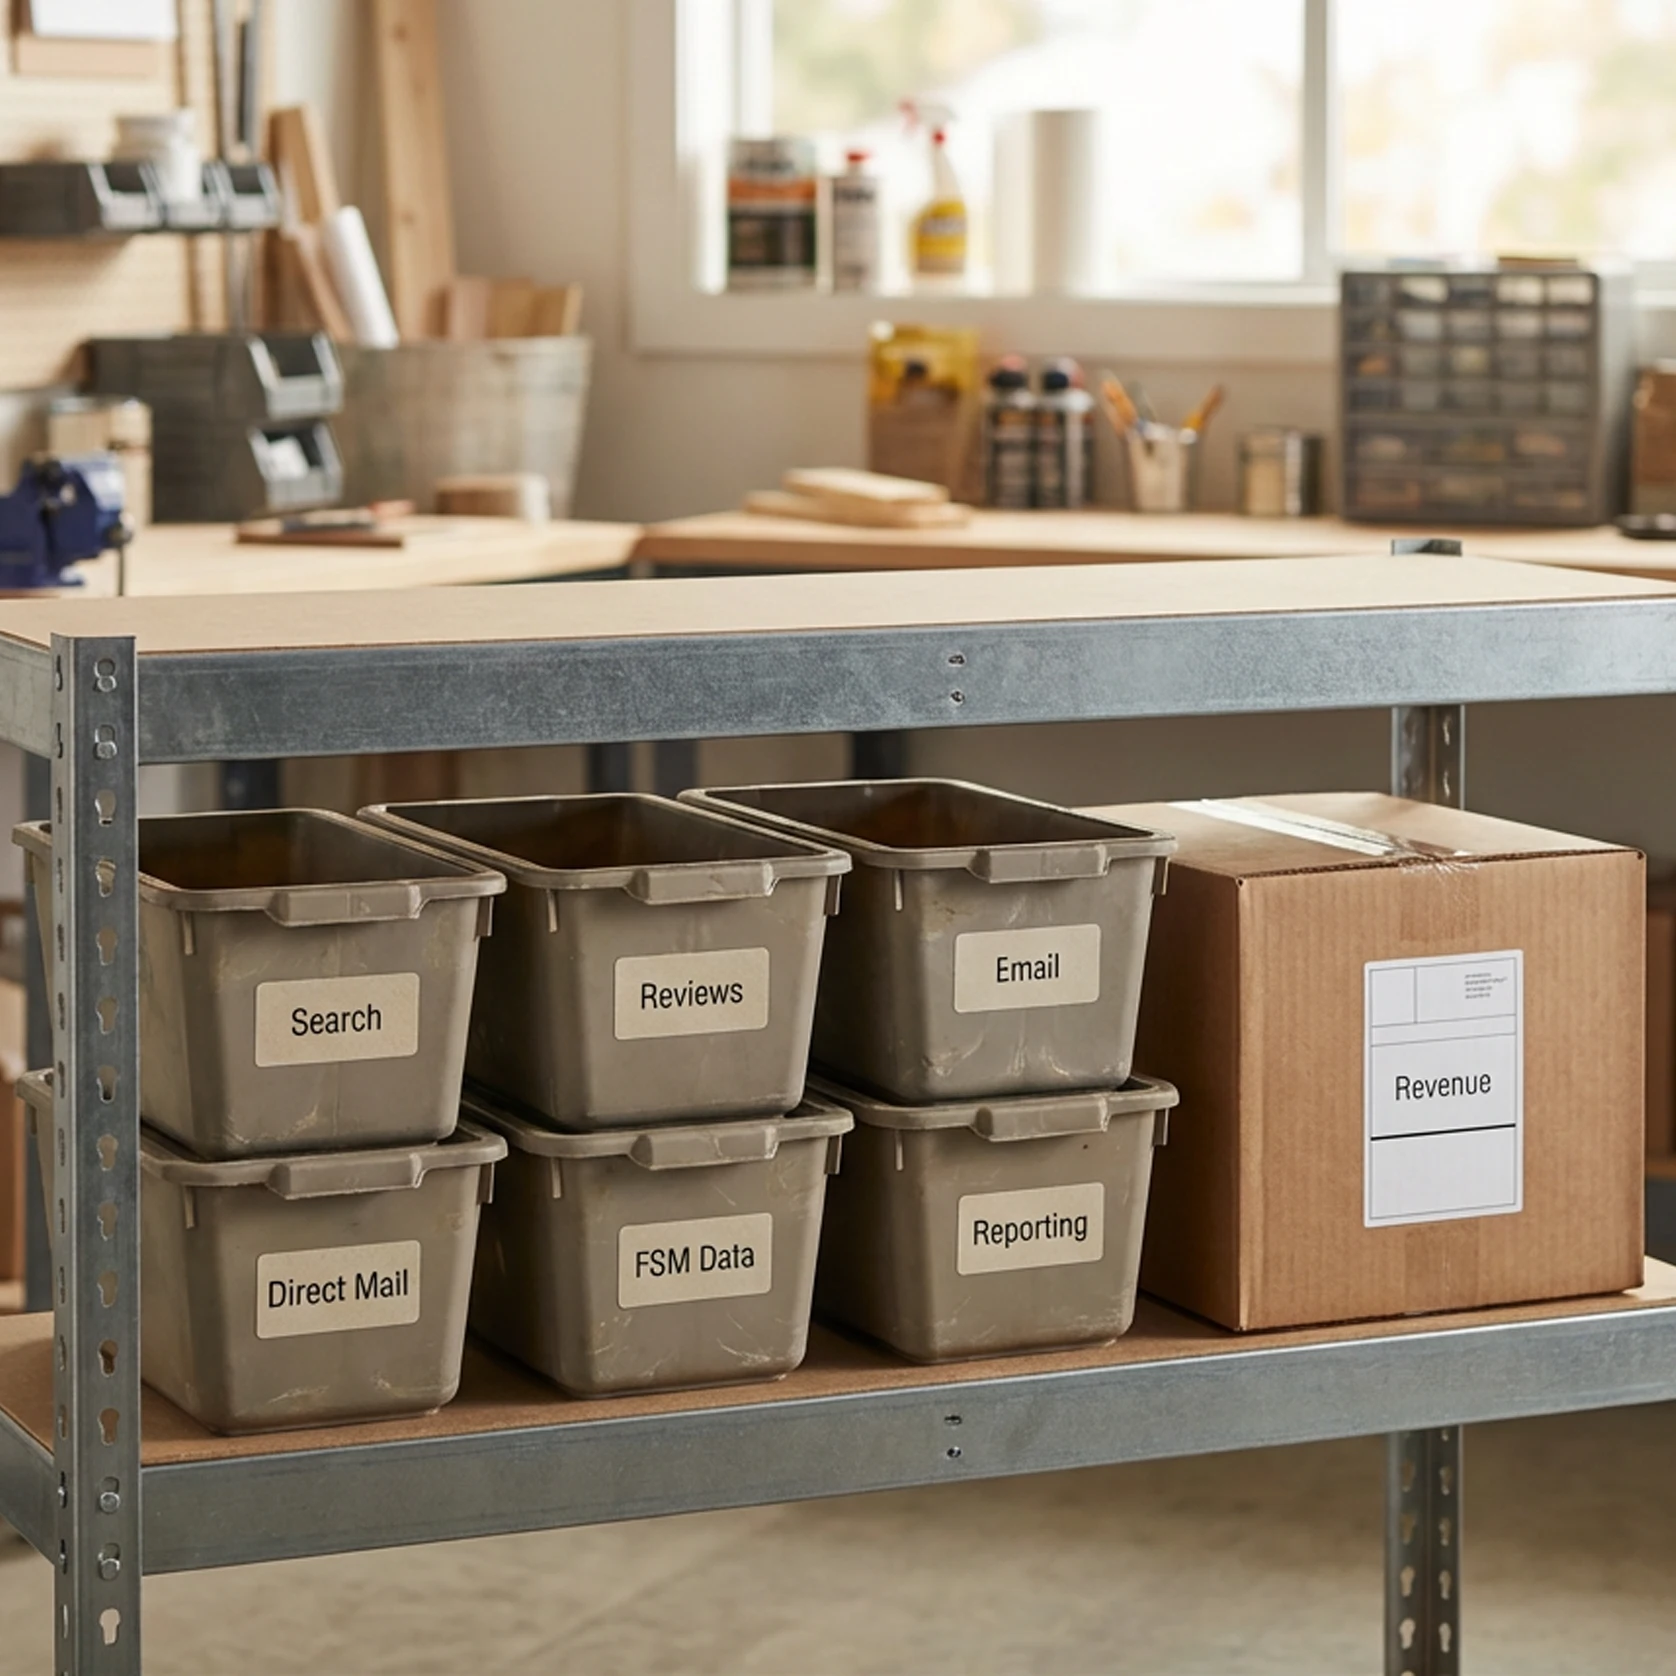
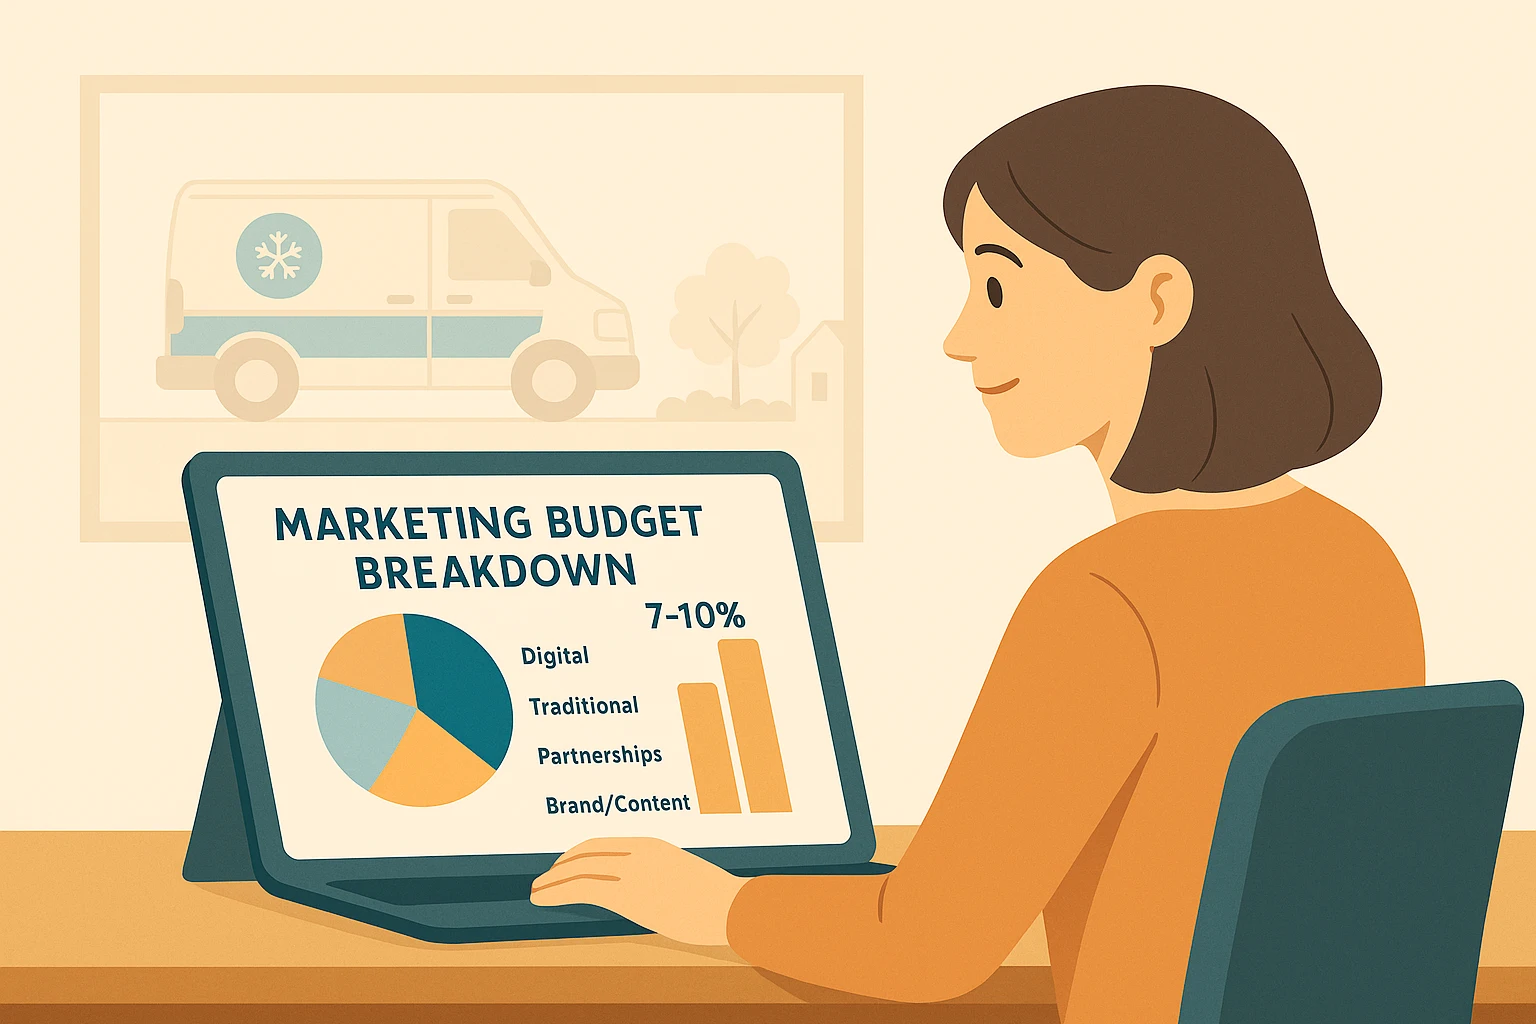
The Optimal HVAC/Plumbing/Electrical Marketing Budget Breakdown
The companies getting the best results don’t just spend more—they allocate smarter:
40–60% Digital Marketing:
Google Local Service Ads, Search Ads, SEO, social ads, review management.
Digital captures high-intent customers at the exact moment they need service.
15–25% Traditional Marketing:
Direct mail, vehicle wraps, yard signs, and print.
A well-designed truck still delivers 30,000–70,000 impressions a month.
10–20% Partnerships & Community:
Real estate agents, property managers, sponsorships, referral programs.
These sources often close at 60–70%—your best possible leads.
10–15% Brand & Content:
Website development, video, photography, blog content, and conversion-focused copywriting.
Where Email Marketing Fits Into the Budget
Email marketing and automated follow-up sequences are one of the highest ROI channels for HVAC, plumbing, and electrical companies. Although the cost is low, the impact on revenue and retention is significant.
Email marketing fits within the Brand & Content portion of the budget and includes:
- Unsold estimate follow-up automations
- Membership renewal and service reminders
- Seasonal tune-up campaigns
- Slow-season revenue smoothing emails
- After-service review requests
- Re-engagement campaigns for dormant customers
Because email is an owned channel with minimal incremental cost, even small improvements in consistency dramatically increase customer lifetime value and help stabilize revenue year-round.
Media Spend vs. Total Marketing Investment
The 7–10% rule applies to your entire marketing ecosystem, not just ads.
Your total budget includes:
- Media spend (ads, direct mail, sponsorships)
- Marketing staff salaries or agency fees
- Software and technology (CRM, call tracking, email platforms)
- Content creation (photos, video, copywriting)
- Website hosting and maintenance
- Promotional materials
Ad Spend vs. All Other Marketing Costs
Many home service business owners misunderstand the difference between “ad spend” and “total marketing spend.” Paid media is only part of the picture.
Here’s a typical breakdown for HVAC, plumbing, and electrical companies:
| Category | % of Budget | What It Includes |
|---|---|---|
| Paid Media (Ad Spend) | 50–65% | LSAs, PPC, Meta ads, direct mail postage/printing |
| Marketing Labor/Agency | 20–30% | In-house marketing staff, external agency fees |
| Tools & Technology | 5–10% | CRM, email platform, call tracking, scheduling tools |
| Content & Brand | 10–15% | Website, photos, videos, email marketing, blog content |
Understanding these categories prevents the common scenario where a business believes they are investing $5,000/month—when in reality that is just their agency fee, with very little going toward paid media.
Adjusting Your Marketing Budget by Company Stage
New Companies (1–3 Years):
Budget 10–15% to build awareness fast.
Mature Companies (10+ Years):
Can hold at 6–8% thanks to established brand equity.
Expansion Mode:
Entering a new service area requires 12–15% until recognition catches up.
Premium Positioning:
If you charge 20–40% more, you must invest 9–12% to support the premium brand image.
How to Evaluate Marketing ROI
Before you scale spending, ensure these fundamentals are healthy:
Close Rate: At least 30–40% on qualified estimates.
Unit Economics: Average job value should be 3X your acquisition cost.
Operational Capacity: Can you handle 20–30% more volume?
The Most Common Marketing Budget Mistakes
Mistake 1: Only Spending “What Feels Comfortable”
A $2M contractor spending $1,000/month is investing 0.6%, that’s not enough to grow.
Mistake 2: Cutting Marketing During Slow Periods
This delays recovery and hands market share to competitors.
Mistake 3: Relying on a Single Channel
Local Service Ads and Google Ads alone, or direct mail alone, is fragile. Diversify.
Mistake 4: Not Tracking Results
Without tracking, optimization is impossible. Implement call tracking, ask customers how they found you, and review performance monthly.
How to Implement This in Your Business: Your 4-Week Action Plan
Week 1: Calculate Your True Current Spend
Include every marketing-related cost. This number is often surprising.
Week 2: Audit Your Allocation
Review how your current spend compares with industry benchmarks.
Week 3: Set Your Target Budget
Base it on revenue and growth goals, not guesswork.
Week 4: Rebalance and Test
Shift gradually toward a balanced mix. Give channels 90 days to prove performance.
The Bottom Line: Marketing Is a Growth Engine
The difference between companies that stall and companies that scale isn’t the quality of their work, it’s their willingness to invest consistently and strategically in marketing.
When you spend 7–10% of revenue, allocate it intelligently, and track it rigorously, marketing becomes your most predictable driver of growth.
Your next step: pull last year’s financials, calculate your true marketing percentage, and see where you stand. The number will tell you exactly what your growth potential looks like.
Frequently Asked Questions
Want help building a data-backed marketing budget for your home service company? Get in touch and we’ll create a customized plan.